

We often get questions about how to keep close track of customers’ server health to make sure that there’s always enough capacity and to keep our eyes open for trends that can impact performance and uptime.
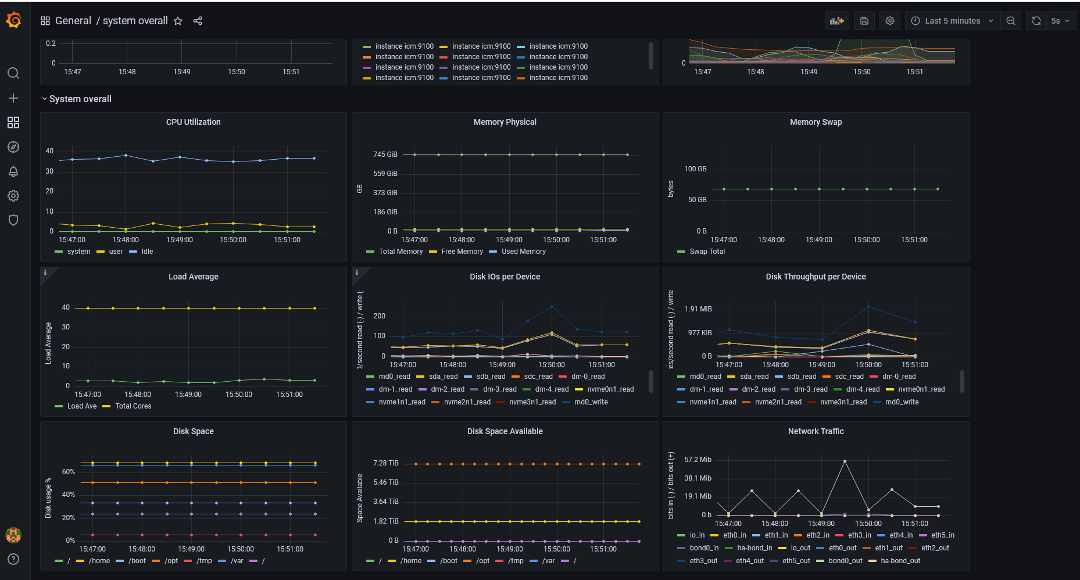
This year we started using a popular monitoring system called Prometheus that captures IC Manage server metrics and visualizes the metrics on Grafana dashboards. Many in the IT community are familiar with those tools and we’ve installed those at many key customers so that they can get a real time view and alerts based on the activity of their IC Manage and Perforce server components.

.png)
Some of the key metrics we can record are:
Memory, Disk IO, CPU Activity, Load Avg, Swap, Disk Space Available, Network Traffic Perforce Process Count, Commands Processed per Minute, Top Commands, Errors, Read Locks, Write Locks, Lock Waits, Command Duration
Connections, Client Threads, Queries, Slow Queries, Table Locks, Network Traffic, Network Usage, Memory Usage, Top Command by hour, Cache Memory Usage, File Opens
Connections per 1 min, Connection per 5 min , Active Connection Count, Server Status
Virtual Memory, Thread Count, Request Count, Client Connections, DB Cache Rate, DB File Size
To configure these for your environment, please contact us at support@icmanage.com
Additional information:
https://grafana.com/docs/grafana/latest/getting-started/get-started-grafana-prometheus/
https://www.perforce.com/blog/vcs/implement-prometheus-monitoring-grafana-dashboards
